Introduction This is Part Two of the article describing a potential implementation of Request Based LDAP Group Membership provisioning. Part One can be accessed here. Continuing with the implementation after disabling the default approval policies at the Request and Operation Levels, the next step is to configure OIM to enable the modification of a provisioned […]
↧
OIM 11g OID (LDAP) Groups Request-Based Provisioning with custom approval – Part II
↧
Neat pro-tip for getting the ECID in BPEL
A neat trick for getting your ECID in a BPEL process.
↧
↧
Event Delivery Network (EDN) – A practical example
↧
Tune Audit Trail in SOA 11G to Avoid Memory and Transaction Problems
Until 11.1.1.3, BPEL audit trails are saved to database in the same JTA transaction as the main transaction. This causes three main problems:Most common: Latency of saving audit trail to database is included as part of the overall latency of the main b...
↧
Configure Adapter Threads in Oracle SOA 11G
In in earlier posting, I mentioned you can configure multiple threads of inbound (polling) adapters of Oracle SOA. However, the ways to configure multiple threads vary between adapters and product versions, and the information scatter cross multiple do...
↧
↧
Configure Adapter Threads in Oracle SOA 10G
In a separate posting, I mentioned you can configure multiple threads of inbound (polling) adapters of Oracle SOA. However, the ways to configure multiple threads vary between adapters and product versions, and the information scatter across multiple documentations. Hence it is worth to consolidate them here.
This post is for Oracle SOA 10.1.3.x. I have another blog post for configuring adapter threads in Oracle SOA 11G.
1. JMS Adapter
- For BPEL: Set 'adapter.jms.receive.threads' as activation agent properties in bpel.xml
<activationAgents>
<activationAgent className=“…" partnerLink="MsgQueuePL">
...     <property name="adapter.jms.receive.threads”>5</property>
</activationAgent>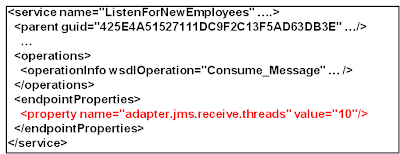
</activationAgents>- For OESB 10.1.3.3 onward: Set as endpoint property via JDeveloper (10.1.3.3) or directly at *.esbsvc file
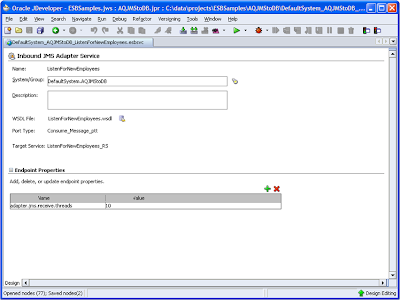
2. AQ Adapter
This blog summarizes the different kind of settings for AQ Adapter threads very well. Let me copy and paste it below:
#### FOR ESB/BPEL 10.1.3.4.x
<property name="adapter.aq.dequeue.threads">NO_OF_THREADS</property>
#### FOR BPEL 10.1.3.3.x
<property name=activationInstances">NO_OF_THREADS<property>
#### FOR ESB 10.1.3.3.x
<endpointProperties>
<property name="numberOfAqMessageListeners" value="NO_OF_THREADS"/>
</endpointProperties>
3. MQ Adapter
Oracle Support Tech Note How to limit number of threads for reading messages from a queue (Doc ID 1144847.1] describes the details of how to setup the threads for Inbound MQAdapter . Copying here:
There exist a parameter called "InboundThreadCount" which is valid for both 11g and also it is tested on SOA 10.1.3.5, And Confirmed to be working on 10.1.3.4.
To set the parameter, Please add the following to the Inbound MQ Adapter
<jca:operation
ActivationSpec="oracle.tip.adapter.mq.inbound.SyncReqResActivationSpecImpl"
MessageType="REQUEST"
QueueName="INBOUND_QUEUE"
Priority="AS_Q_DEF"
Persistence="AS_Q_DEF"
InboundThreadCount="1" <==== This parameter
Expiry="NEVER"
OpaqueSchema="true" >
</jca:operation>
4. Database Adapter
It takes multiple steps to configure database adapter threads.
Step 1: Configure distributed polling. The query in the polling database adapter needs to be a distributed polling in order to avoid data duplication.
To set usesSkipLocking in SOA 10.1.3.x, you must first declare the property in ra.xml, then set the value in oc4j-ra.xml. No re-packaging or redeployment of DbAdapter.rar is needed.
Step 2. Set activationInstances as activation properties at bpel.xml to achieve multiple threads in database adapter.
Note: There is another property called NumberOfThreads. This property is NOT supported in clustered environment or when activationInstances>1 in SOA 10.1.3.x, or even at versions prior to SOA 11.1.1.3.
Step 3. Tune MaxTransactionSize and MaxRaiseSize to throttle the incoming messages along side with activationAgents/NumberOfThreads. These two properties are configured either through the DbAdapter wizard at JDeveloper, or manually directly at the WSDL file of the DbAdapter
5. File/FTP Adapter
File/FTP adapter's has a separation poller thread and processor thread (comparatively, JMS/AQ adapters always use the same thread to poll and process). There is always only one poller thread, while there could be multiple processor threads. In SOA 10.1.3.x, the processor threads are globally shared among File and FTP adapter instances, while in 11G you have an option to configure private processor thread pool per adpater *.jca file.
In SOA 10.1.3.x, the configuration file for you to set the File/FTP adapter processor threads are:
[SOA_HOME]\bpel\system\services\config\pc.properties
[SOA_HOME]\integration\esb\config\pc.properties (need to rename from pc.properties.esb)
The property name is:
oracle.tip.adapter.file.numProcessorThreads=4
If BPEL and ESB co-located at the same OC4J container, the pc.properties for BPEL takes precedence over that of ESB . In such cases, the values set in SOA_HOME\bpel\system\service\config\pc.properties will suffice
↧
Writing a Human Task UI in .Net (C#/ASP.NET) or in fact anything other than ADF
As you know, you can create the user interfaces for your human tasks using ADF. JDeveloper allows you to auto-generate a human task user interface (form) and it also includes a wizard that gives you a bit more control over … Continue reading →
↧
Choosing BPMN or BPEL to model your processes
With Dave Shaffer Recently, I had a discussion with several colleagues and one of our large customers about when to use BPMN and when to use BPEL to model business processes. I have discussed this topic before in this post … Continue reading →
↧
Unit Testing Asynchronous BPEL Processes Using soapUI
This is a topic I have been interested in for a while. I have seen it done by some of my colleagues, especially in AIA environments, and I have been waiting to get an opportunity to work on it and … Continue reading →
↧
↧
SOA 11g & SAP – Single Channel/Program ID for Multiple IDOCs
When integrating with SAP using the Oracle 11g Application Adapter, it may be desirable to simplify integrations requiring a large number of IDOCs to leverage a single channel/SAP Program ID for multiple IDOC types. However, the standard practice for the Application Adapter is to create a separate channel for each inbound service (aka, single channel/SAP Program ID for a single IDOC type). The following write-up will illustrate a way to allow multiple IDOCs to flow to a single Application Adapter Channel.
↧
Encapsulating OIM API’s in a Web Service for OIM Custom SOA Composites
Introduction This document describes how to encapsulate OIM API calls in a Web Service for use in a custom SOA composite to be included as an approval process in a request template. We always recommend customers to follow this approach when trying to invoke OIM’s APIs inside SOA composites used as approval processes for the […]
↧
A Universal JMX Client for Weblogic –Part 1: Monitoring BPEL Thread Pools in SOA 11g
Monitoring and optimizing BPEL Thread Pool utilization (and other metrics) is one of the key activities in performance tuning of BPEL/SOA based integrations. Although EM console provides some basic monitoring of the BPEL engine statistics, it is limited regarding the update interval, detail and the recording interval and cannot display historic data. Of course you can setup Grid Control 11g with its Repository, but this is in most cases too complex to setup just for monitoring during performance and load testing.
So, the idea came to create a tool which can easily record these statistics and export them to MS Excel or OpenOffice to create charts for the thread pool utilization over a time period (for example a whole load test execution).
All values of WLS or the SOA engine can be queried using the JMX MBean framework. I have designed the JMXClient to be able configure which MBeans should be queried by using a property file (beans.properties). I decided to connect in this first release to only one Managed Server of WLS to record / export data. This means that if you have a WLS cluster, you need to start multiple JMX Clients to record the values of each node. (In a later release the JMX Client could be optimized to query all nodes automatically).
JMXClient can be used by downloading from the project page at Sourceforge. (including JDeveloper 11.1.1.6 project and sources)
After that you need to configure
- your connection properties, JAVA_HOME and WLS_HOME of your WLS managed server of SOA in jmxclient.bat (or jmxclient.sh)
- the MBeans names, WLS Server name and the attributes to record in classes/beans.properties (you can find the MBean names form the System MBean Browser in EM)
The syntax in jmxclient.bat is
java -cp classes;%INCLUDE_LIBS% jmxclient.JMXClient <server> <user> <password> -monitor 1000
For example
java -cp classes;%INCLUDE_LIBS% jmxclient.JMXClient 192.168.56.101 7001 weblogic welcome1 -monitor 1000
“1000” specifies the interval in milliseconds between the recording.
Then you can run it with
jmxclient > out.txt
Then simple import this text file using Excel or OpenOffice and a comma “,” as delimiter and create a line chart using line 2 as titles and lines 3 to end as data.
Let me first show a couple of results using JMXClient using the properties to record the BPEL thread pool statistics:
The following chart shows a scenario where the invoke thread pool is much too low (20) so that the queue of scheduled invocations waiting for a free thread is growing rapidly:

The second example shows a scenario where invoke and callback threads are within normal limits:

In the next posts I will show how to use JMXClient to record the BPEL process execution times or the number of messages in the AIA 11g JMS queues by simply exchanging the beans.properties file…..!
Have fun,
Stefan
DISCLAIMER: JMXClient is provided for free use “as is” without any support or warranty. Please provide enhancements or modifications you make yourself. Feedback is welcome using the comments feature of this blog.
PS: for the experts: the format of the beans.properties file:
Every line contains 3 items separated by semicolon:
- the name of the MBean to query
- the attribute to query
- the title string which should be displayed for the column
Example for the bpel thread pools:
oracle.dms:Location=AdminServer,name=/soainfra/engines/bpel/requests/invoke,type=soainfra_bpel_requests;active_maxValue;Invoke Active Max
oracle.dms:Location=AdminServer,name=/soainfra/engines/bpel/requests/invoke,type=soainfra_bpel_requests;scheduled_maxValue;Invoke Scheduled Max
oracle.dms:Location=AdminServer,name=/soainfra/engines/bpel/requests/invoke,type=soainfra_bpel_requests;scheduled_value;Invoke Scheduled Current
oracle.dms:Location=AdminServer,name=/soainfra/engines/bpel/requests/invoke,type=soainfra_bpel_requests;active_value;Invoke Active Value
oracle.dms:Location=AdminServer,name=/soainfra/engines/bpel/requests/invoke,type=soainfra_bpel_requests;threadCount_value;Invoke Threads Value
oracle.dms:Location=AdminServer,name=/soainfra/engines/bpel/requests/invoke,type=soainfra_bpel_requests;threadCount_maxValue;Invoke Threads Max
oracle.dms:Location=AdminServer,name=/soainfra/engines/bpel/requests/system,type=soainfra_bpel_requests;active_maxValue;System Active Max
oracle.dms:Location=AdminServer,name=/soainfra/engines/bpel/requests/system,type=soainfra_bpel_requests;scheduled_maxValue;System Scheduled Max
oracle.dms:Location=AdminServer,name=/soainfra/engines/bpel/requests/system,type=soainfra_bpel_requests;scheduled_value;System Scheduled Current
oracle.dms:Location=AdminServer,name=/soainfra/engines/bpel/requests/system,type=soainfra_bpel_requests;active_value;System Active value
oracle.dms:Location=AdminServer,name=/soainfra/engines/bpel/requests/system,type=soainfra_bpel_requests;threadCount_value;Invoke Threads Value
oracle.dms:Location=AdminServer,name=/soainfra/engines/bpel/requests/system,type=soainfra_bpel_requests;threadCount_maxValue;Invoke Threads Max
oracle.dms:Location=AdminServer,name=/soainfra/engines/bpel/requests/engine,type=soainfra_bpel_requests;active_maxValue;Engine Active Max
oracle.dms:Location=AdminServer,name=/soainfra/engines/bpel/requests/engine,type=soainfra_bpel_requests;scheduled_maxValue;Engine Scheduled Max
oracle.dms:Location=AdminServer,name=/soainfra/engines/bpel/requests/engine,type=soainfra_bpel_requests;scheduled_value;Engine Scheduled Current
oracle.dms:Location=AdminServer,name=/soainfra/engines/bpel/requests/engine,type=soainfra_bpel_requests;active_value;Engine Active value
oracle.dms:Location=AdminServer,name=/soainfra/engines/bpel/requests/engine,type=soainfra_bpel_requests;threadCount_value;Engine Threads Value
oracle.dms:Location=AdminServer,name=/soainfra/engines/bpel/requests/engine,type=soainfra_bpel_requests;threadCount_maxValue;Engine Threads Max
oracle.dms:Location=AdminServer,name=/soainfra/engines/bpel/requests/audit,type=soainfra_bpel_requests;active_maxValue;Audit Active Max
oracle.dms:Location=AdminServer,name=/soainfra/engines/bpel/requests/audit,type=soainfra_bpel_requests;scheduled_maxValue;Audit Scheduled Max
oracle.dms:Location=AdminServer,name=/soainfra/engines/bpel/requests/audit,type=soainfra_bpel_requests;scheduled_value;Audit Scheduled Max
oracle.dms:Location=AdminServer,name=/soainfra/engines/bpel/requests/audit,type=soainfra_bpel_requests;active_value;Audit Active value
oracle.dms:Location=AdminServer,name=/soainfra/engines/bpel/requests/audit,type=soainfra_bpel_requests;threadCount_value;Audit Threads Value
oracle.dms:Location=AdminServer,name=/soainfra/engines/bpel/requests/audit,type=soainfra_bpel_requests;threadCount_maxValue;Audit Threads Max
↧
New BPEL Thread Pool in SOA 11g for Non-Blocking Invoke Activities from 11.1.1.6 (PS5)
Up to release 11.1.1.5 there have been 4 thread pools in Oracle SOA Suite 11g to control parallelism of execution:
- Invoke Thread Pool (for asynchronous invocations)
- Engine Thread Pool (i.e. for callback execution)
- System Thread Pool
- Audit Thread Pool
Starting with 11.1.1.6 there is one (still undocumented) new thread pool introduced for non-blocking invoke activities.
Here is a view of the System MBean Browser:

The MBean name is:
oracle.dms:Location=soa_server1,name=/soainfra/engines/bpel/requests/non-block-invoke,type=soainfra_bpel_requests
You can change a synchronous invoke activity from a blocking call to non-blocking by using the partnerlink level property:

This thread pool is configured in SOA-Administration –> BPEL Service Engine Properties under “More BPEL Configuration Properties...” with the property DispatcherNonBlockInvokeThreads:

Be aware that the default is only 2 – so this can be a bottleneck in high load scenarios if not changed. Especially if you have multiple partnerlinks using non-blocking calls – because all of them share this thread pool…
Have fun, Stefan
↧
↧
AIA/SOA Trips & Tricks (4) : How to Save AIA/BPEL 11g Execution Time Statistics Programmatically in a File
Accessing and saving statistics is quite different in SOA 11g – this is done through JXM MBeans and not anymore by calling a BPEL API.
The following example shows how to retrieve the execution time statistics for all BPEL components deployed to one SOA server.
The example output is:
FOUND 15
Time BPEL Name Count Min Avg Max
11:48:19 ProcessFOBillingAccountListRespOSMCFSCommsJMSProducer 6 326 2568.6666666666665 3068
11:48:19 UpdateSalesOrderSiebelCommsProvABCSImplProcess 6 1482 1821.5 2236
11:48:19 CommsProcessFulfillmentOrderBillingAccountListEBF 6 16590 22458.5 29167
11:48:19 ProcessFulfillmentOrderBillingResponseOSMCFSCommsJMSProducer 6 28 166.5 842
11:48:19 AIAAsyncErrorHandlingBPELProcess 4 1459 1758.5 2065
11:48:19 ProcessFulfillmentOrderBillingBRMCommsProvABCSImplProcess 6 1805 2462.8333333333335 4031
11:48:19 QueryCustomerPartyListSiebelProvABCSImplV2 10 640 2639.8 11079
11:48:19 AIASessionPoolManager 20 13 96.0 1344
11:48:19 ProcessSalesOrderFulfillmentOSMCFSCommsJMSProducer 10 94 562.9 1930
11:48:19 ProcessFulfillmentOrderBillingBRMCommsAddSubProcessProcess 6 773 1211.0 1577
11:48:19 SyncCustomerPartyListBRMCommsProvABCSImpl 10 323 2956.0 4045
11:48:19 TestOrderOrchestrationEBF 6 39979 46680.166666666664 52206
11:48:19 ProcessSalesOrderFulfillmentSiebelCommsReqABCSImplProcess 10 1125 2247.1 6522
11:48:19 CommsProcessBillingAccountListEBF 10 7342 12365.5 22876
11:48:19 AIAReadJMSNotificationProcess 4 9 54.5 124
You can easily paste the output in Excel to display charts like:


You also can periodically retrieve the statistics to determine if there is any performance degrade for some BPEL processes over time.
Lets see how the JMX API is used to achieve this:
First we need to establish a connection to the MBean server – for this we use the same method as we did in our JMXClient:
public static void initConnection(String hostname, String portString,
String username,
String password) throws IOException,
MalformedURLException {
String protocol = "iiop";Integer portInteger = Integer.valueOf(portString);
int port = portInteger.intValue();
String jndiroot = "/jndi/";
String mserver = "weblogic.management.mbeanservers.domainruntime";JMXServiceURL serviceURL =
new JMXServiceURL(protocol, hostname, port, jndiroot + mserver);Hashtable h = new Hashtable();
h.put(Context.SECURITY_PRINCIPAL, username);
h.put(Context.SECURITY_CREDENTIALS, password);
h.put(JMXConnectorFactory.PROTOCOL_PROVIDER_PACKAGES,
"weblogic.management.remote");
// Wait timeout 60 seconds
h.put("jmx.remote.x.request.waiting.timeout", new Long(60000));
connector = JMXConnectorFactory.connect(serviceURL, h);
connection = connector.getMBeanServerConnection();
}
After that we retrieve all Mbeans which have the same pattern:
String mBeanName =
"oracle.dms:Location=" + servername + ",soainfra_composite_label=*,type=soainfra_component,soainfra_component_type=bpel,soainfra_composite=*,soainfra_composite_revision=*,soainfra_domain=default,name=*";Set<ObjectInstance> mbeans =
connection.queryMBeans(new ObjectName(mBeanName), null);
System.out.println("FOUND " + mbeans.size());
This matches the display in Enterprise Manager “System MBean Browser”:

Now, we can query each MBean for the attributes
- Name
- successfulInstanceProcessingTime_completed
- successfulInstanceProcessingTime_minTime
- successfulInstanceProcessingTime_avg
- successfulInstanceProcessingTime_maxTime
That’s it!
You can find the complete JDeveloper project here.
The same statistics can of course be retrieved as well programmatically for composites (services) and references.
↧
New whitepaper “SOA 11g – The Influence of the Audit Level on Performance and Data Growth”
I have created a new whitepaper comparing the effect of different Audit Level settings in SOA/AIA 11g: SOA 11g - The Influence of the Audit Level on Performance and Data Growth - A comparison using AIA 11.1 and 11.2 COMMS Order-to-Bill PIPs. Plea...
↧
EDN Debugging
I have a customer asked me about how to debug EDN. This blog will show you how to debug EDN and the tools that can be used to debug EDN.
<!--[if !supportLists]-->1.<!--[endif]-->Using EDN-DB-LOG
EDN comes with a useful EDN DB logging servlet to view logging information generated by the EDN component. It is only available for END-DB which is based on AQ, it will not work for EDN with JMS. The servlet uses a table called “EDN_LOG_MESSAGES” in SOA_INFRA schema. It logs the operation on “main” operation of event_queue and oaoo-queue with timestamp information.
The default URL is http://<host_name>:<port_number>/soa-infra/events/edn-db-log. In this servlet, you can enable, disable and clear logs but you need to have the administrative role in order to access the servlet. This is a good tool to use to display dynamic counts of un-deq'ed events (potentially "stuck") in the "main" and "OAOO" queues. The log also provides information of EDN bus when it is being connected to AQ-DB. In the screenshot below, “EVENT_SEQ:202” shows that the EDN bus is being started.

When the logging is enabled, the EDN_LOG_MESSAGES table will be populated with messages until the logging is disabled, so it is inadvisable to leave logging turned on for large amounts of events. It is recommended to clear the log regularly.
Messages in the log are grouped together. Usually the first line in the group will indicate what operation is being performed, and the event sequence number is used to group the messages together and each group will be highlighted using the same color (e.g. enqueuing an event or handling an event that has been dequeued). In the screenshots below, “EVENT_SEQ:204” is dequeuing an event and “EVENT_SEQ:205” is enqueuing an event.


2. Database tables
The second method is to examine the database table. You can check on count of potentially “stuck” events currently in the following queue tables:
- EDN_EVENT_QUEUE_TABLE – This table is for “EDN_EVENT_QUEUE” AQ. Every event published is temporarily enqueued into this table.
- EDN_OAOO_DELIVERY_TABLE – This table only stores the event with “OAOO” (one-and-only-one) delivery target(s). The event is temporarily enqueued into this table for END_OAOO_QUEUE AQ.
For event with OAOO delivery target, it travels through both tables, first it is stored in EDN_EVENT_QUEUE_TABLE and then in EDN_OAOO_DELIVERY_TABLE.
This example shows the event enq'ed in "edn_event_queue".

Another alternative is to check the count from the following database views:
- AQ$EDN_EVENT_QUEUE_TABLE: There are two rows for every event enqueued into "edn_event_queue".
- AQ$EDN_OAOO_DELIVERY_TABLE: There is one row for every event enqueued into "edn_oaoo_queue".
This example shows further details about that event which is deq'ed by the subscribers of "edn_event_queue".

The AQ$EDN_EVENT_QUEUE_TABLE.MSG_STATE shows the state of the message. The states are listed in the table below:
State Code
| Value
| Description
|
0
| Ready
| The message is ready to be processed, i.e., either the delay
|
1
| Wait
| The delay specified by message_properties_t.delay while executing dbms_aq.enqueue has not been reached.
|
2
| Processed
| The message has been successfully processed (dequeued) but will remain in the queue until the retention_time specified for the queue while executing dbms_aqadm.create_queue has been reached.
|
3
| Expired
| The message was not successfully processed (dequeued) in either 1) the time specified by message_properties_t.expiration while executing dbms_aq.enqueue or 2) the maximum number of dequeue attempts (max_retries) specified for the queue while executing dbms_aqadm.create_queue.
|
8
| Deferred
| Buffered messages enqueued by a Streams Capture process
|
10
| Buffered Expired
| User-enqueued expired buffered messages
|
If the subscriber type is equal to 2 when there is no subscribers to the message, and there is no transaction id due to invalid transaction, it will be marked as UNDELIVERABLE.
When the state message is expired, the AQ$EDN_EVENT_QUEUE_TABLE.EXPIRATION_REASON will be populated with one of the following value:
- Messages to be cleaned up later
- MAX_RETRY_EXCEEDED
- TIME_EXPIRATION
- INVALID_TRANSACTION
- PROPAGATION_FAILURE
3.<!--[endif]-->Server Logs
The third method is using EM log configuration and log viewer. There are few logger names related the EDN:
- oracle.integration.platform.blocks.event
- oracle.integration.platform.blocks.event
- oracle.integration.platform.blocks.event.saq
- oracle.integration.platform.blocks.event.jms
You can set log level to one of the following to capture more details:
- TRACE:1 (FINE) - Logging the event content details, XPath filter results, event enqueue, dequeue, publish and send operations
- TRACE:16 (FINER) – Logging the begin, commit and rollback statements of XA transaction (for OAOO) and retry count.
- TRACE:32 (FINEST) - All above.

The log level changes take effect immediately without server restart.However, if you want the changes to persist after server restart, make sure to check on the “Persist Log Level State Across Component Restarts” prior to server restart.
At FINER or FINEST level, you may see loggings like "Began XA for OAOO." and "Rolled back XA for OAOO." These are normal messages of OAOO event delivery when there are no events waiting to be delivered. They are NOT errorred conditions. You may turn off these messages by setting the Java logging level to "TRACE:1 (FINE)" or a higher value. All detailed logging goes into SOA server's diagnostic.log file configured in EM. Below is a snippet of the diagnostic log showing the event delivery to an OAOO subscriber:
[SRC_METHOD: finerBeganXA] Began XA for OAOO.
[SRC_METHOD: fineEventPublished] Received event: Subject: ... Sender: .... Event: ...
[SRC_METHOD: fineFilterResults] Filter [XPath Filter: …] for subscriber "..." returned true/false
[SRC_METHOD: fineDequeuedEvent] Dequeued event, Subject: ... [source type ..]: business-event...
[SRC_METHOD: fineOAOOEnqueuedEvent] Enqueued OAOO event, Subject: ... [source: ..., target: ... ]: business-event...
[SRC_METHOD: fineOAOODequeuedEvent] Dequeued OAOO event, Subject: ... [source: ..., target: ...]: business-event...
[SRC_METHOD: finerInsertedTryCount] Inserted try count for msgId: .... Status: ...
[SRC_METHOD: finerRemovedTryCount] Removed try count for msgId: ...
[SRC_METHOD: fineSentOAOOEvent] Sent OAOO event [QName: ... to target: ...]: business-event...
[SRC_METHOD: fineCommittedOAOODelivery] Committed OAOO Delivery, Subject: ... [source: ..., target: ...]: business-event...
[SRC_METHOD: finerBeganXA] Began XA for OAOO.
[SRC_METHOD: finerRolledbackXA] Rolled back XA for OAOO.
In some cases, more than one method may be necessary to assist in the debugging process. Below is a comparison of server and DB logging that might help you in evaluating and determining which method(s) is/are most suitable in your environment.
Server Logging
- EDN will generate standard Java logging messages when events are published, when they are pulled from persistent storage and when they are delivered.
- The logger used by EDN depends on the implementation. For instance, EDN-DB uses "oracle.integration.platform.blocks.event.saq" and EDN-JMS uses "oracle.integration.platform.blocks.event.jms".
- As in all Java logging, messages are written at different log levels from ERROR to FINEST. The most detailed messages (including the event body) use FINEST.
- Loggers can also be configured in logging.xml in your config directory.
DB Logging
- If you are using EDN-DB, a lot of debugging information may not be accessible due to the many activities that occurred in the database which couldn’t be logged in the server. Hence, a servlet web page that accesses the debug logging table is implemented to assist the debugging process. The page is located at: http://hostname:port/soa-infra/events/edn-db-log and you do need to have administrative role to access the servlet page.
- There are commands on the servlet web page to enable and disable logging and for clearing the log table. The table will be filled with messages, so it is inadvisable to leave logging turned on for large amounts of events. It is recommended to clear the log regularly.
- Messages in the log are grouped together. Usually the first line in the group will indicate what operation is being performed (e.g. enqueuing an event or handling an event that has been dequeued).
<!--[if !supportLists]-->
↧
Mediator Parallel Routing Rules
Introduction In 11g, mediator executes routing rules either sequentially or in parallel. If you are planning to use parallel routing rules, you would need to understand how the mediator queues and evaluates routings in parallel in different threads. This article describes 2 different threads used in the parallel routing rules and the design consideration if […]
↧
↧
Using OSB 12.1.3 Resequencer
Resequencer feature has been added to Oracle Service Bus 12c (12.1.3), it utilises the same resequencer engine as Oracle Mediator. The objective of this feature is to provide you with the ability to resequence the incoming messages that arrive in random order and send them to the target services in an orderly manner. In this […]
↧
REST Adapter and JSON Translator in SOA/OSB 12.1.3
If you are using REST adapter in SOA/OSB 12.1.3, you would probably encounter some requirements that you would need to response with a JSON array format which has no object name or name/value pairs, and must be a valid format according to RFC4627 specification. For example: [“USA”,”Canada”,”Brazil”,”Australia”,”China”,”India”] In SOA/OSB 12.1.3, the REST adapter requires you […]
↧
How to find purgeable instances in SOA/BPM 12c
If you are familiar with SOA/BPM 11g purging, after you have upgraded/implemented SOA/BPM 12c, you will not be able to use most of the SQL for 11g to determine the purgeable instances. This is because SOA/BPM 12c is no longer using composite_instance table for composite instance tracking. In SOA/BPM 12c, a common component is used to […]
↧


